A Guide To Advanced Site Speed Auditing.
Tuesday, October 25, 2022
Performing a site speed audit can be a daunting task, there is a lot of information out there and various guides, but for the most part it only tells you about the importance of site speed and how to check on different metrics. This is then followed by which metrics are the most important and why they should be improved, but there isn’t a whole lot of actionable outcomes for you to follow.
HC

Written by

As a disclaimer, as an SEOer, I will audit a website then give changes to the development team to action.
The following speed audit example will require Google Chrome & DevTools, PageSpeed Insights & Screaming Frog.
Step 1. Check PageSpeed Insights
The first step is to benchmark the various page templates – homepage, category, subcategory, product, blog hub, blog posts. This should highlight the main metrics which need work and some of the issues which should be addressed.
The example below shows the Time To Interactive and Largest Contentful Paint of the homepage on this particular website, needs to be addressed.
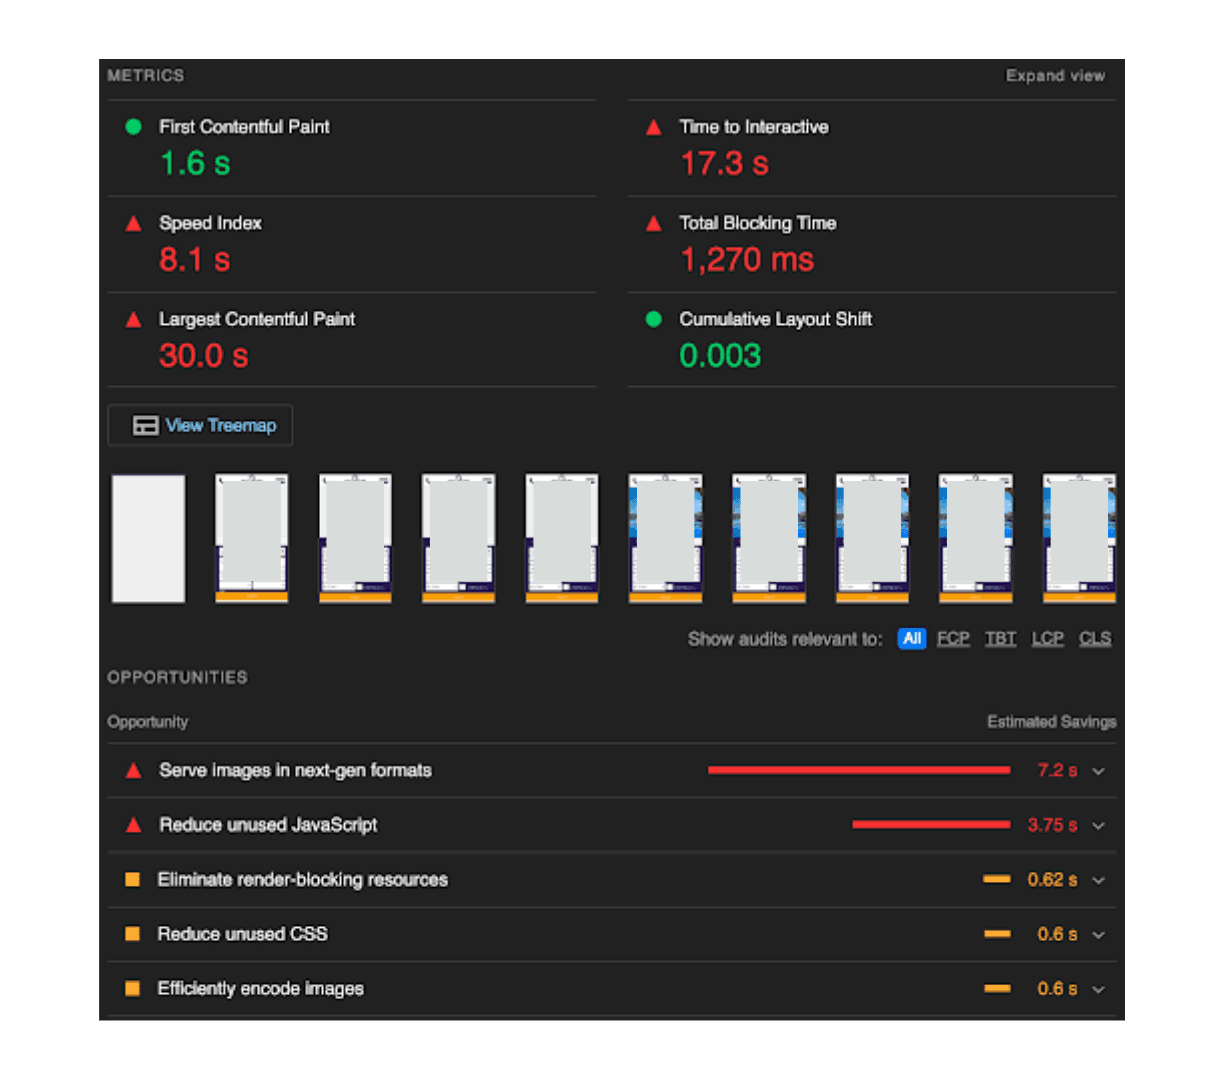
Collating the information from the various templates will illustrate some main ideas which can be translated into tasks for improving the speed. Clicking into the various Opportunities dropdowns can give ideas on how to improve the website, however these should always be taken with a pinch of salt, as they are quite broad with potentially massive impacts.
Continuing with this example; by clicking into ‘Eliminate render-blocking resources’, we see a recommendation to “Consider delivering critical JS/CSS inline and deferring all non-critical JS/styles”. This happens to be the perfect move for this, after investigation, as the file as a whole is blocking site rendering. By removing certain CSS and adding it inline, while moving the rest of the file down the load order, would help greatly. On this occasion, the recommendations happen to be perfectly on target, but I have often seen broader opportunities recommended which could have detrimental impact if actioned without a more in depth consideration.
Step 1.5. Screaming Frog Crawl (Optional)
Screaming Frog is a great tool for bulk analysing URLs as it crawls a website checking for the PageSpeed Insights items you have requested.
The configuration I use is as follows:
Configuration > API > PageSpeed Insights.
Set up API key, click ‘here’ > then click ‘Get a key’, then copy this and paste it back into Screaming Frog.
Metrics
CrUX Metrics > Core Web Vitals Assessment, CrUX First Contentful Paint Time (sec), CrUX First Input Delay Time (ms), CrUX Largest Contentful Paint Time (sec), CrUX Layout Shift,Crux Interaction to Next Paint (ms), CrUX Time to First Byte (ms).
Lighthouse Metrics > Performance Score, First Contentful Paint Time (sec), Speed Index Time (sec), Time To Interactive (sec), Total Blocking Time (ms), Cumulative Layout Shift
Device = Mobile.
Opportunities > anything ending with (ms)
Diagnostics > Image Elements Do Not Have Explicit Width & Height, Avoid Large Layout Shifts.
Go back on Account Information and press Connect, then OK.
As a rule of thumb, I will tick everything nested under Overview, and everything else that is related to time i.e. secs or ms. I prefer metrics that give me a solid number rather than a score, as I find these to be easier to contextualise against targets.
Speed results for this can be found in the Internal Tab and Scrolling to the right. The specific results e.g. Efficiently Encode Images or Minify CSS, are found if you scroll down on the tab to the right until the option appears.
By using these specific lists or filtering by the other scores in the Internal tab, it will reveal the templates that need addressing the most.
Step 2. GTmetrix
GTmetrix was my baptism by fire for site speed. I knew a website desperately needed improving in terms of site speed, but I wasn’t sure of anything beyond the basic “web devs please fix”. After spending a long time reading around the topic, I am now sharing it with you!
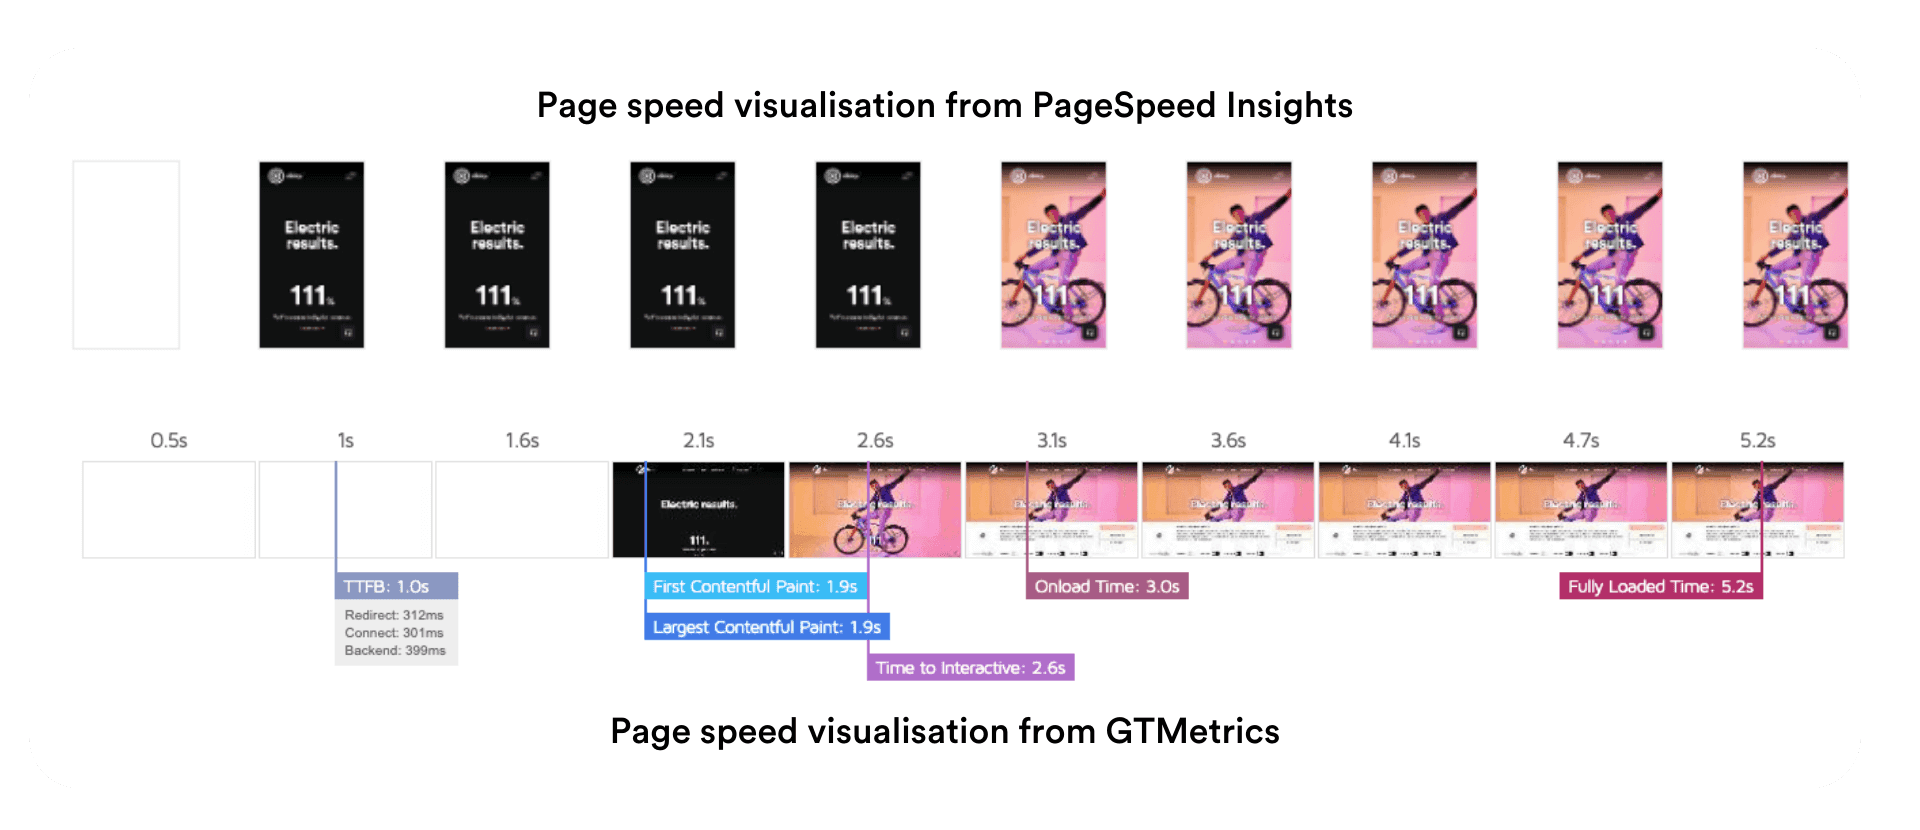
Step 2.1. Speed Visualisation
The Speed Visualisation is a series of screenshots of a chosen page along its load journey. This gives you a visual representation of how the site looks at various load points. This is also a feature of PageSpeed Insights. I use them both congruently to discover any discrepancies. I find the GTmetrix visualisation easier to use as it gives markers showing when the various timing events have occurred.
Step 2.2. Top Issues
This is similar to the PageSpeed Insights ‘Opportunities’ section, wherein it details, in priority order, certain actions which will have the largest impact on the website. These again have quite generic recommendations such as ‘Avoid enormous network payloads’ (typically high image sizes) or ‘Avoid an excessive DOM size’ (typically caused by page builders with lots of <div> elements). So again, just take everything with a pinch of salt.
Any large sweeping change should be verified before being actioned, and some can be partially tested as shown in Step 3 of this article.
Step 2.3. Waterfall
GTmetrix’s waterfall is where the bulk of the information I use comes from!
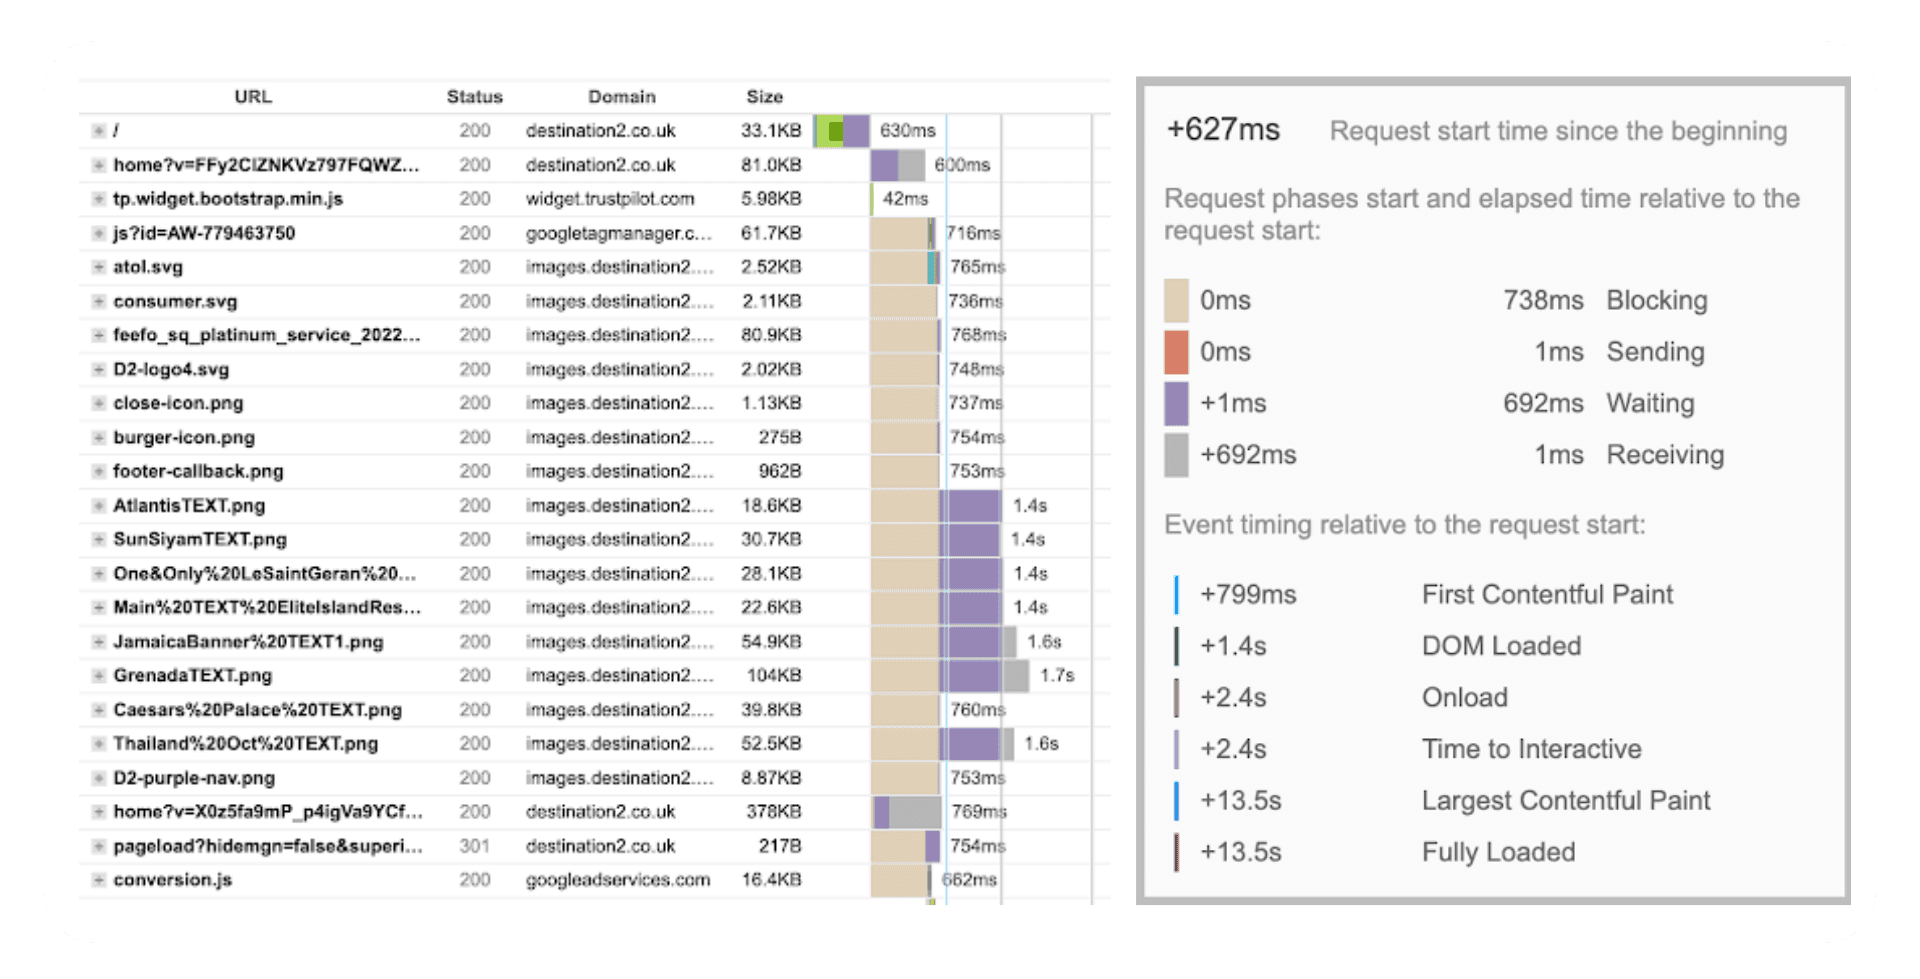
The waterfall can look scary at first glance, with all its horizontal and vertical lines, but there is a great guide on how to read the GTmetrix Waterfall Chart. Basically, all you need to know is that the file names run down the left, followed by their status codes, their domain of origin, and their file size.
This is followed by the most important part, the ‘Load Time Breakdown’, which details the load time of each section of each request. This can be used to indicate what needs investigating. If everything has a long waiting time, we know the server is slow, if the LCP is delayed massively, maybe we need to preload that request or move it higher up the load order. Clicking a file will give you information about its Request & Response Headers, while hovering over its breakdown will bring up its event timings.
Looking at the below image, we can see that all of the requests, bar 3, have a high blocking time, meaning something is blocking them from being fulfilled. Coincidentally, the 2nd file down is the same size as everything being blocked, so this is what I would investigate.
It is the same file as mentioned by PageSpeed Insights which said to “Consider delivering critical JS/CSS inline and deferring all non-critical JS/styles”, as this is the main CSS file on the page. This easy logic can be applied throughout most of the waterfall. If one of the main events (TTFB, FCP, Onload, TTI, LCP, FLT) is being particularly delayed, you can follow it back to the main file delaying it. Often it is something simple, like an image request being too large and needing to be compressed. However, as mentioned above it can sometimes be more complicated, such as changing the load order of files, so that there is no blocking. The way to test this is in Step 3.
Step 3. DevTools
DevTools is a great sandbox for testing site speed changes as it shows you in real time what is happening to the website. In order to start this process, right click your page and click ‘Inspect’, this will open DevTools (pro tip: click the three dots on the right then the first icon and it will detach and go fullscreen). Click on to the Network tab, then refresh your page in order to populate the tab.
This will generate a list of all the files that have been requested during the load, and anything that changes as you navigate around the page, such as clicking anything dynamic.
Bonus!
When using the Network tab of DevTools, it is important to keep your own Chrome Extensions out of the load, otherwise you could skew the results. Clicking through the Name list will reveal the Headers on the right-hand side. Anything with a Request URL beginning with ‘chrome-extension’ should be blocked. To do this, right click the name of the file, then ‘Block request domain’. At the top of the bottom section of DevTools, next to the ‘Console’ tab are three dots, click this and click ‘Network request blocking’. Ensure the ‘Enable network request blocking’ is ticked. After this, refresh the page and you should see all the blocked files appear in red. This means that they are no longer impacting the load.
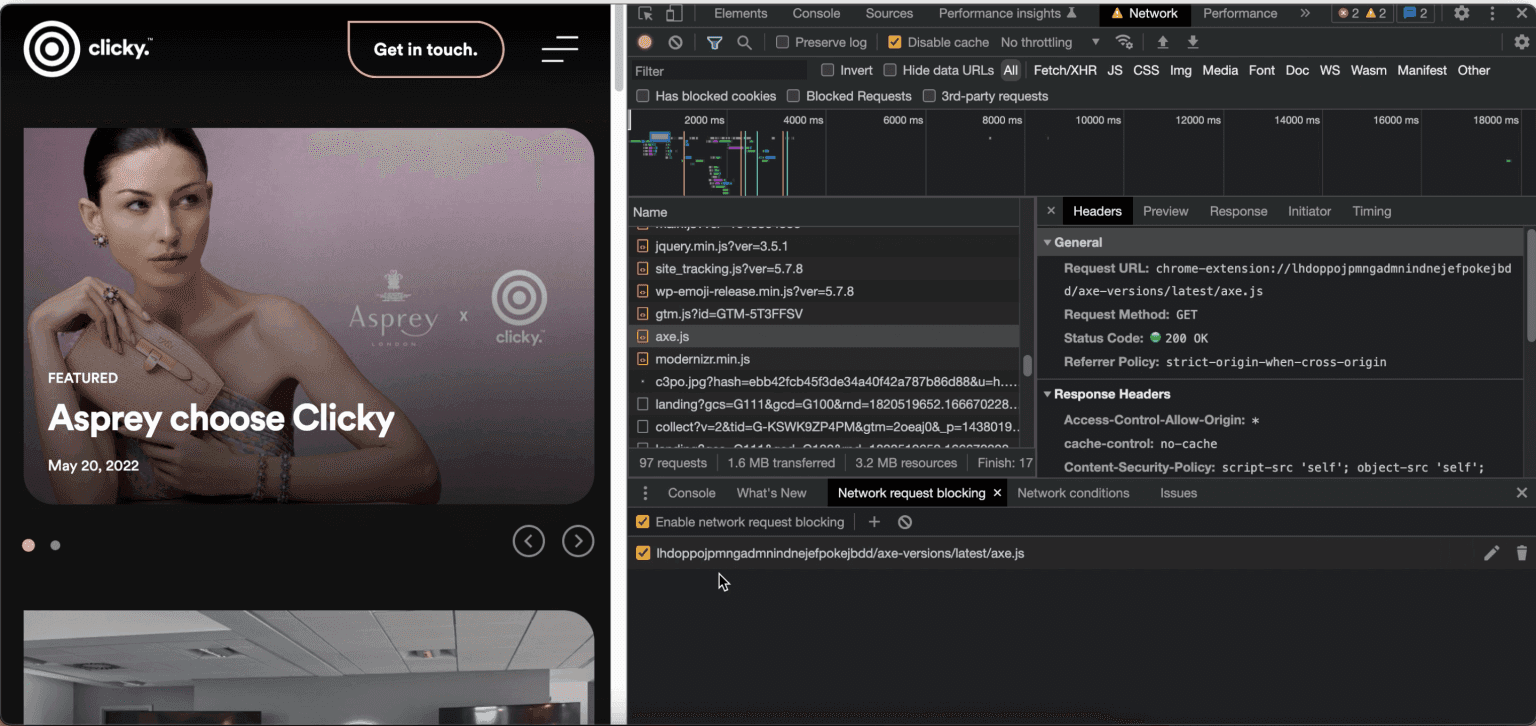
Here we can block the file that was highlighted in both PageSpeed Insights, and see the impact. If we block it outright, it removes pretty much the entire CSS from the page, and just leaves HTML and images all left-aligned and disorderly. Being unable to defer the entire file means looking more closely at the the file itself, so the action for the developers would be, as PageSpeed Insights suggested “Consider delivering critical JS/CSS inline and deferring all non-critical JS/styles”, meaning the developers should split out the code needed to first format the page and write it in-line so the images at the top of the load order aren’t being blocked, and defer the rest of the code / file. I appreciate this now looks like a very roundabout way of doing something that was suggested in the first step, but it is always import to check your work when it is something as potentially site-breaking as this, and the outcome could have been very different.
Main offenders
Some typical issues that a lot of websites will see are below:
CSS image: images are loaded from the CSS file instead of through the on-page HTML which means the browser gets to them that little bit later.
Images are too large: this is both in terms of the size of the image in bytes and the image dimensions. Use image compression and srcset to declare the best image sizes suited for various viewports.
Old tracking scripts: the older a website is, the more likely it is to have outdated tracking script from old software or old companies slowing down the website.
Banner images: these use lazy loading tags, which massively delays LCP.
Step 4. Presenting The Information
Giving your web developers a list of URLs saying they all have LCP issues isn’t likely to be useful and therefore unlikely to be fixed. And if they are, there will certainly be a lot of back and forth on exactly what needs doing, or the developers will decide to change what they think is a priority. In order to display your information properly, I set out a list of easy headers:
Priority – as with most audits, setting priorities means the most impactful changes will be made first. I will usually go with anything server related first, or changes that impact several metrics or templates.
Address – the page/pages the files are located on.
File – the exact file name.
File Type – image, stylesheet, JavaScript etc.
Origin – where the file originates, i.e. from the host domain or from a third-party.
Metric – list out the metrics impacted by the change, this should be any event in the ‘load time breakdown’ after the requested file.
Recommendation – what exactly should the developer do, in as precise terms as possible, whether be deferring a file or preloading it.
BONUS!
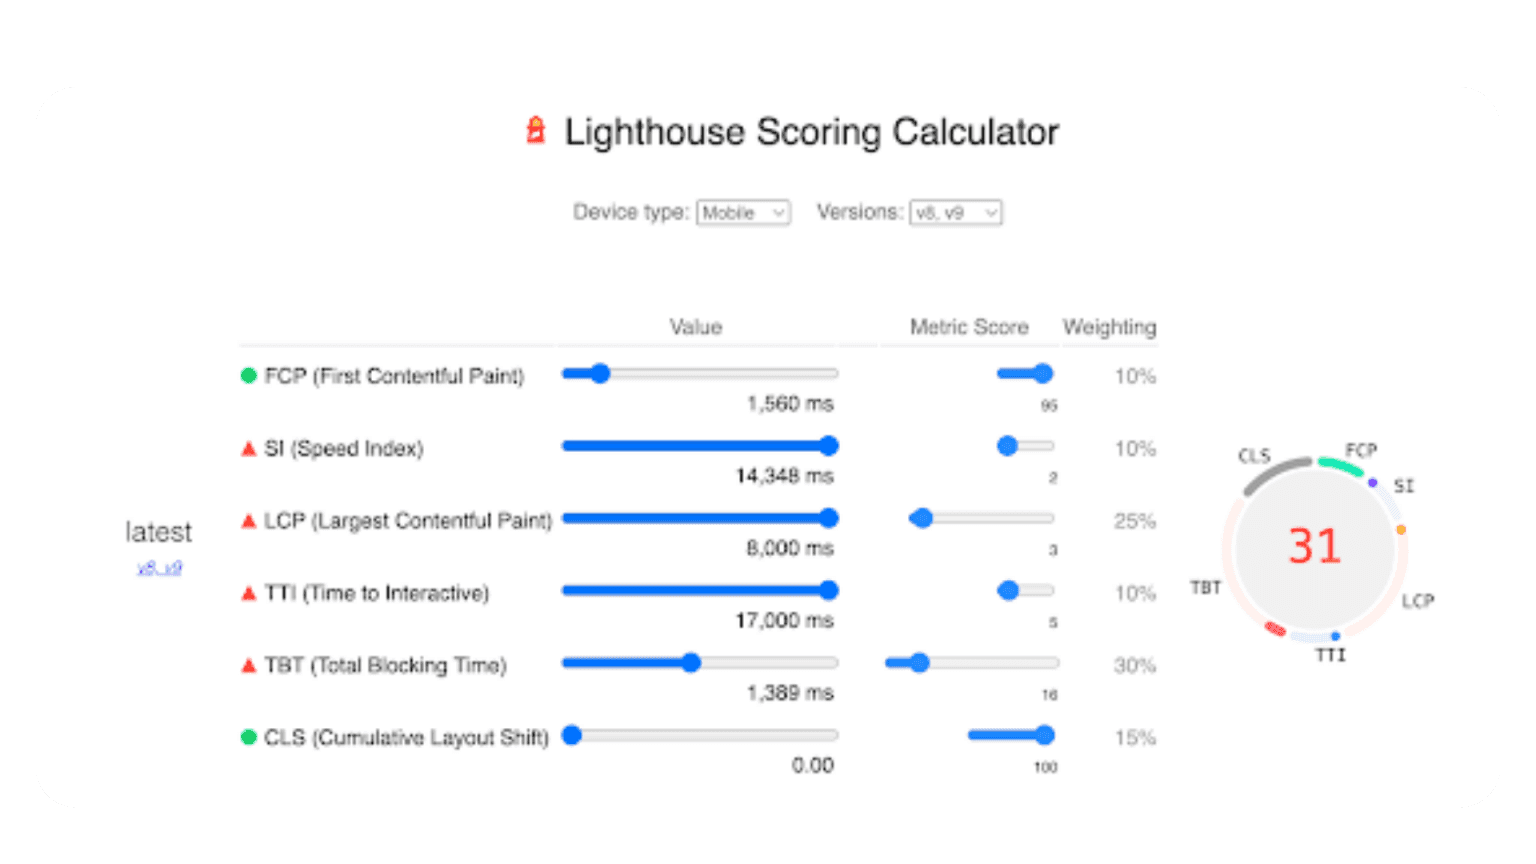
PageSpeed Insights and Lighthouse both link towards a calculator which quantifies the weighting of the various metrics. This can be a particularly useful way of demonstrating the effects on Performance Scores when any particular metric is improved. From the example below, we can see that the largest weighting lies with Total Blocking Time at 30% followed by Largest Contentful Paint at 25%. We can determine from these weightings that keeping load order concise, and improving load of the largest page elements are particularly important to Google.
FCP (First Contentful Paint) = 10%
SI (Speed Index) = 10%
LCP (Largest Contentful Paint) = 25%
TTI (Time to Interactive) = 10%
TBT (Total Blocking Time) = 30%
CLS (Cumulative Layout Shift) = 15%
Conclusion
Firstly, if you’ve reached this point, well done! Obviously, this is a very comprehensive and technical process for site speed auditing. Not all items and metrics that have been mentioned will always be necessary and some, maybe due to website configuration, will be hard to influence. However, hopefully this opens a discussion within your SEO team and also gives your developers a lot more to work with than a typical site speed audit. I hope this guide will help you and ignite a new passion for site speed to what you’ve previously had!